Monitorix
3.2 / 20 ratings
Monitorix is a free, open source, lightweight system monitoring tool designed to monitor as many services and system resources as possible. It has been created to be used under production Linux/UNIX servers, but due to its simplicity and small size can be used on embedded devices as well.
The monitoring includes the following graphs:
- System load average and usage (system.rrd)
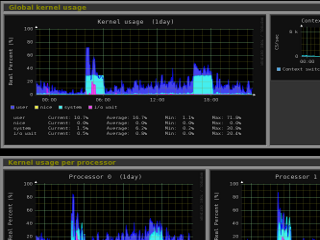
- Global kernel usage (kern.rrd)
- Per-processor kernel usage (proc.rrd)
- HP ProLiant System Health (hptemp.rrd)
- LM-Sensors and GPU temperatures (lmsens.rrd)
- NVIDIA temperatures and usage (nvidia.rrd)
- Disk drive temperatures and health (disk.rrd)
- Filesystem usage and I/O activity (fs.rrd)
- System services demand (serv.rrd)
- Mail statistics (mail.rrd)
- Network port traffic (port.rrd)
- FTP statistics (ftp.rrd)
- Apache statistics (apache.rrd)
- Nginx statistics (nginx.rrd)
- Lighttpd statistics (lighttpd.rrd)
- MySQL statistics (mysql.rrd)
- Squid Proxy Web Cache statistics (squid.rrd)
- NFS server statistics (nfss.rrd)
- NFS client statistics (nfsc.rrd)
- BIND server statistics (bind.rrd)
- NTP statistics (ntp.rrd)
- Fail2ban statistics (fail2ban.rrd)
- Icecast Streaming Media Server statistics (icecast.rrd)
- Raspberry Pi sensor statistics (raspberrypi.rrd)
- Alternative PHP Cache statistics (phpapc.rrd)
- Memcached statistics (memcached.rrd)
- Wowza Media Server (wowza.rrd)
- Devices interrupt activity (int.rrd)
- Support for monitoring remote servers (Multihost).
- Support for monitoring (as gateway) the Internet traffic of LAN devices.
- Alert capabilities supported.
- Built-in HTTP server.
- Complete email reporting mechanism of all graphs.
- Ability to view statistics per day, week, month or year.
- Ability to view statistics in graphs or in plain text tables.
- Ability to zoom in any graph to see it in more detail.
- Ability to show network metrics in MBytes/sec or Mbits/sec.
- Ability to show temperatures in Celsius or in Fahrenheit.
- Ability to configure the number of years of historical data (up to 5 years).
- Web interface offers minimal learning, ubiquitous access.
- Configuration with only one text-plain file.
- Silent mode to be able to retrieve the graphs from scripts.
- Traffic statistics are stored in fixed-size databases (RRDtool).
- Perl language based (lightweight tool).
- Supported systems: GNU/Linux, FreeBSD, OpenBSD and NetBSD.

| Home Page | Monitorix |
| Version | 3.14.0 |
| Contributor | bigfoot65 |
| Updated | about 4 years ago |
| Tags | system monitor, cpu, temp, drives, network |
| Share | |
| Status |
|
Want to add your own app or package your favorite app here? Become a contributor and submit apps!